| Kory Melby BR Ag Consultant |
|
BR'S EXPORTS-IMPORTS
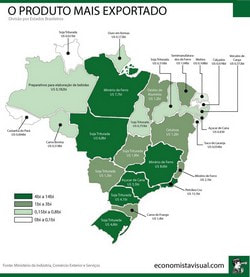
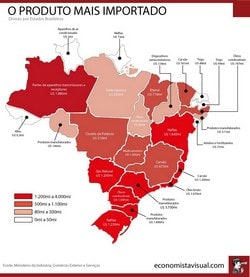
The Primary Products Exported and Imported by State
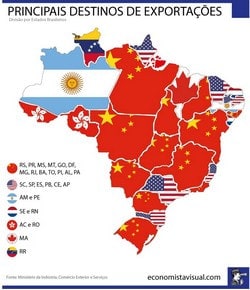
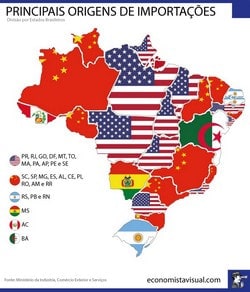
Export Destinations and Origin of Imports by State
Brazil Export Product Groups by Dollar Value
Export Destinations and Origin of Imports by State
Brazil Export Product Groups by Dollar Value
EXPORT-IMPORT NOTES:
- Agro exported US$166 billion in 2023, 49% of Brazil's total sales abroad; a record. A 5% increase over 2022.
- Brazilian foreign trade closed 2023 breaking a historic export record, with a trade balance close to US$100 billion and an increase in the number of exporting companies. Last year's consolidated trade balance figures were released this Friday (5/1) by the Ministry of Development, Industry, Commerce and Services.
- Brazil assumes world leadership in the supply of soybean meal.
- Brazil is the largest exporter of soybeans, corn, sugar, orange juice, coffee, beef and chickens. Since 2019, the country has opened markets for more than 200 new agricultural products in dozens of nations.
- The sector closed 2022 with record exports of US$ 159.1 billion, growth of 32% compared to 2021, according to data from the Federal Government.
- Agribusiness exports grew 32% in 2022. The index corresponds to US$ 159 billion. A value that represents almost half of all Brazilian foreign exchange revenue for the period, which was US$ 335 billion. The information was disclosed by the bulletin 'AgroExport'.
- Agribusiness in Brazil is the largest exporter of chicken meat in the world. The country accounts for 15% of all production on the planet.
- MT exports closed 2022 with revenue above US$ 32 billion. The balance of trade reached US$ 26.59 billion and ended the year as the largest in Brazil.
- Brazil sent 53.74 million tons of soybeans to China in 2022.
According to Secex, volume is 11% lower than the 60.476 million tons in 2021.
- SOYBEANS and BEEF. Most ag exported.
- In 2022, Corn exports from Brazil reached a record of 43.2 million tons.
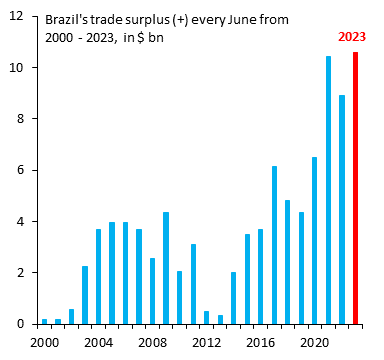
- Brazil has record trade surplus of US$62.3 billion in 2022.
- According to the National Confederation of Agriculture and Livestock (CNA), agribusiness generated practically half of all export revenues from Brazil in 2022.
Brazil Export Products by Dollar Value
The following export product groups categorize the highest dollar value in Brazilian global shipments during 2021. Also shown is the percentage share each export category represents in terms of overall exports from Brazil.
- Ores, slag, ash: US$48.7 billion (17.4% of total exports)
- Oil seeds: $39.2 billion (13.9%)
- Mineral fuels, including oil: $38.4 billion (13.7%)
- Meat: $18.2 billion (6.5%)
- Iron, steel: $14.3 billion (5.1%)
- Machinery, including computers: $10.7 billion (3.8%)
- Sugar, sugar confectionery: $9.4 billion (3.3%)
- Vehicles: $9 billion (3.2%)
- Food industry waste, animal fodder: $8 billion (2.8%)
- Wood pulp: $6.7 billion (2.4%)
https://twitter.com/RobinBrooksIIF/status/1675941248287244288